Processing exposomics data
The CLOTHO Lab employs a suite of data preprocessing and processing algorithms to allow for capturing and explaining the variation in high-dimensional exposome data. After pre-processing, principal component analysis (PCA) may be used to identify patterns in exposure profiles, if any. Linear mixed models (LMMs), generalized linear models, or Bayesian hierarchical models may be also applied, as appropriate.
For single exposure effects on a disease outcome: multivariable regression (linear/logistic/mixed) models are used, adjusting for confounders, such as exposome-wide association models (ExWAS).
For the exploration of multiple exposures and outcome associations: variable selection algorithms including deletion-substitution-addition (DSA), elastic net (ENET), Bayesian kernel machine regression (BKMR), lagged kernel machine regression (LKMR), hierarchical clustering on principal component, partial least squares-discriminant analysis (PLS-DA) are used. Weighted quantile sum (WQS) regression is an option to assess cumulative mixture effects (52). Latent class analysis (LCA) is applied to group participants into exposure and effect clusters.[CK1]
Case Study: This study examined the effects of a TRE intervention treatment for fruits and vegetables (five-a-day portions for seven days in each of the two treatment phases, total of 14 days plus the wash out period) within an ad libitum diet for healthy adults on the chrono-differentiated magnitude and variability of metabolism for a suite of 125 food contaminants/xenobiotics (Kunde et al., 2025). An ExWAS approach together with a LASSO algorithm identified multiple exposures to pesticides, smoking, VOCs, phytoestrogens, parabens, and flame retardants that their metabolism was chrono-differentiated, while some of them (pesticides and VOCs) also exhibited associations with markers of lipid oxidative stress and tissue damage (Fig. 6 & 7). Our findings showed a wide within-subject urinary biomarker of exposure to food contaminants variability; with several biomarkers showing distinct concentration change patterns between the two chrono dietary treatment intervention phases.
Figure 6 The range of z-score adjusted baseline concentrations across participants for each analyte. The vars represent individual analytes, grouped by chemical classification, with their height corresponding to the adjusted concentration values. The y-axis scale ranges from –3 to 7, and a reference line is visualized at zero. This visualization is essential for understanding the variability in baseline concentrations across analytes before intervention. Acronyms can be found in Table S1. https://doi.org/10.1016/j.envint.2025.109682
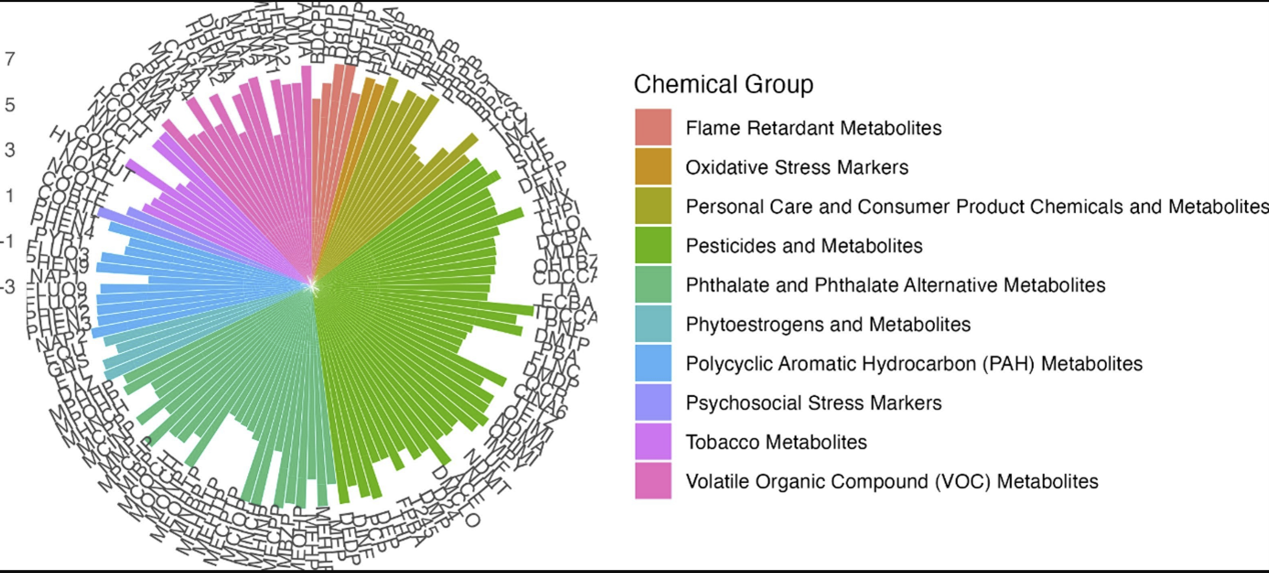
Figure 6 The range of z-score adjusted baseline concentrations across participants for each analyte. The vars represent individual analytes, grouped by chemical classification, with their height corresponding to the adjusted concentration values. The y-axis scale ranges from –3 to 7, and a reference line is visualized at zero. This visualization is essential for understanding the variability in baseline concentrations across analytes before intervention. Acronyms can be found in Table S1. https://doi.org/10.1016/j.envint.2025.109682
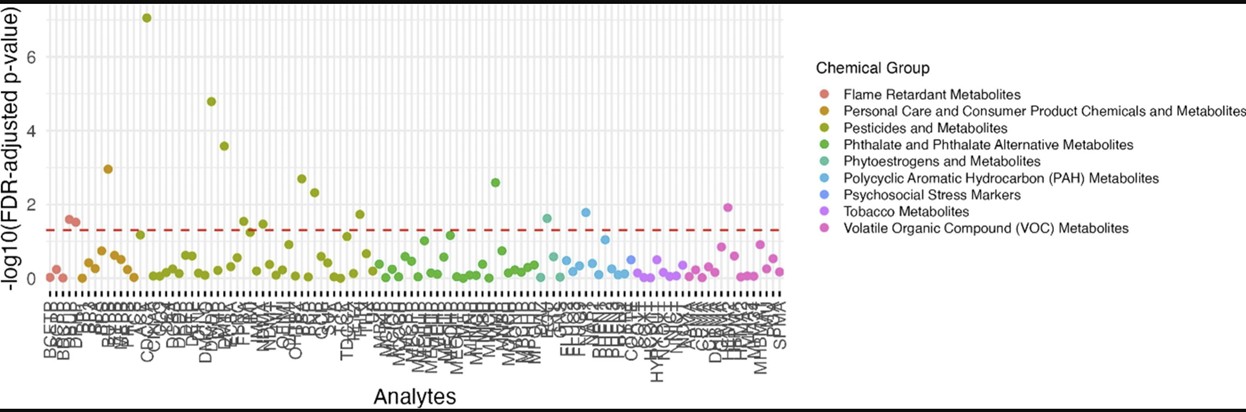
Figure 7 The results of the linear mixed-effects model assessing the association between analyte concentrations and phase, while adjusting for baseline concentrations, cortisol, sex, age, BMI, days since baseline, and a random effect for participant. Each point represents an analyte, with its –log10 FDR-adjusted p-value (q values) plotted on the y-axis. The horizontal dotted line indicates the significance threshold (FDR q-value = 0.05). Analytes above this threshold (n = 15) are considered statistically significant. https://doi.org/10.1016/j.envint.2025.109682
Selected studies by CLOTHO Lab processing exposomics data
H Kunde, EI Ioannou, J Chovatiya, R Jagani, P Charisiadis, M Arora, Makris, KC, 2025. An exposomics analysis of 125 biomarkers of exposure to food contaminants and biomarkers of oxidative stress: A randomized cross-over chrononutrition trial of healthy adults, Environment International, 109682
C Konstantinou, XD Andrianou, A Constantinou, A Perikkou, E Markidou, Makris, KC., 2021. Exposome changes in primary school children following the wide population non-pharmacological interventions implemented due to COVID-19 in Cyprus: A national survey. EClinicalMedicine 32
MK Chung, JS House, FS Akhtari, KC Makris, MA Langston, KT Islam, et al., 2024. Decoding the exposome: data science methodologies and implications in exposome-wide association studies (ExWASs). Exposome 4 (1), osae001
XD Andrianou, C Konstantinou, MA Rodríguez-Flores, F Papadopoulos, Makris, KC, 2022. Population-wide measures due to the COVID-19 pandemic and exposome changes in the general population of Cyprus in March–May 2020. BMC Public Health 22 (1), 2279.
KC Makris, P Charisiadis, T Delplancke, N Efthymiou, A Giuliani, 2022. Diurnal Nonlinear Recurrence Metrics of Skin Temperature and Their Association with Metabolic Hormones in Contrasting Climate Settings: A Randomized Cross-Over Trial. International journal of environmental research and public health 19 (22), 15195.
N Haddad, X Andrianou, C Parrish, S Oikonomou, KC Makris, 2022. An exposome-wide association study on body mass index in adolescents using the National Health and Nutrition Examination Survey (NHANES) 2003–2004 and 2013–2014 data. Scientific Reports 12 (1), 8856